
70 Years of Research on the Jungfraujoch
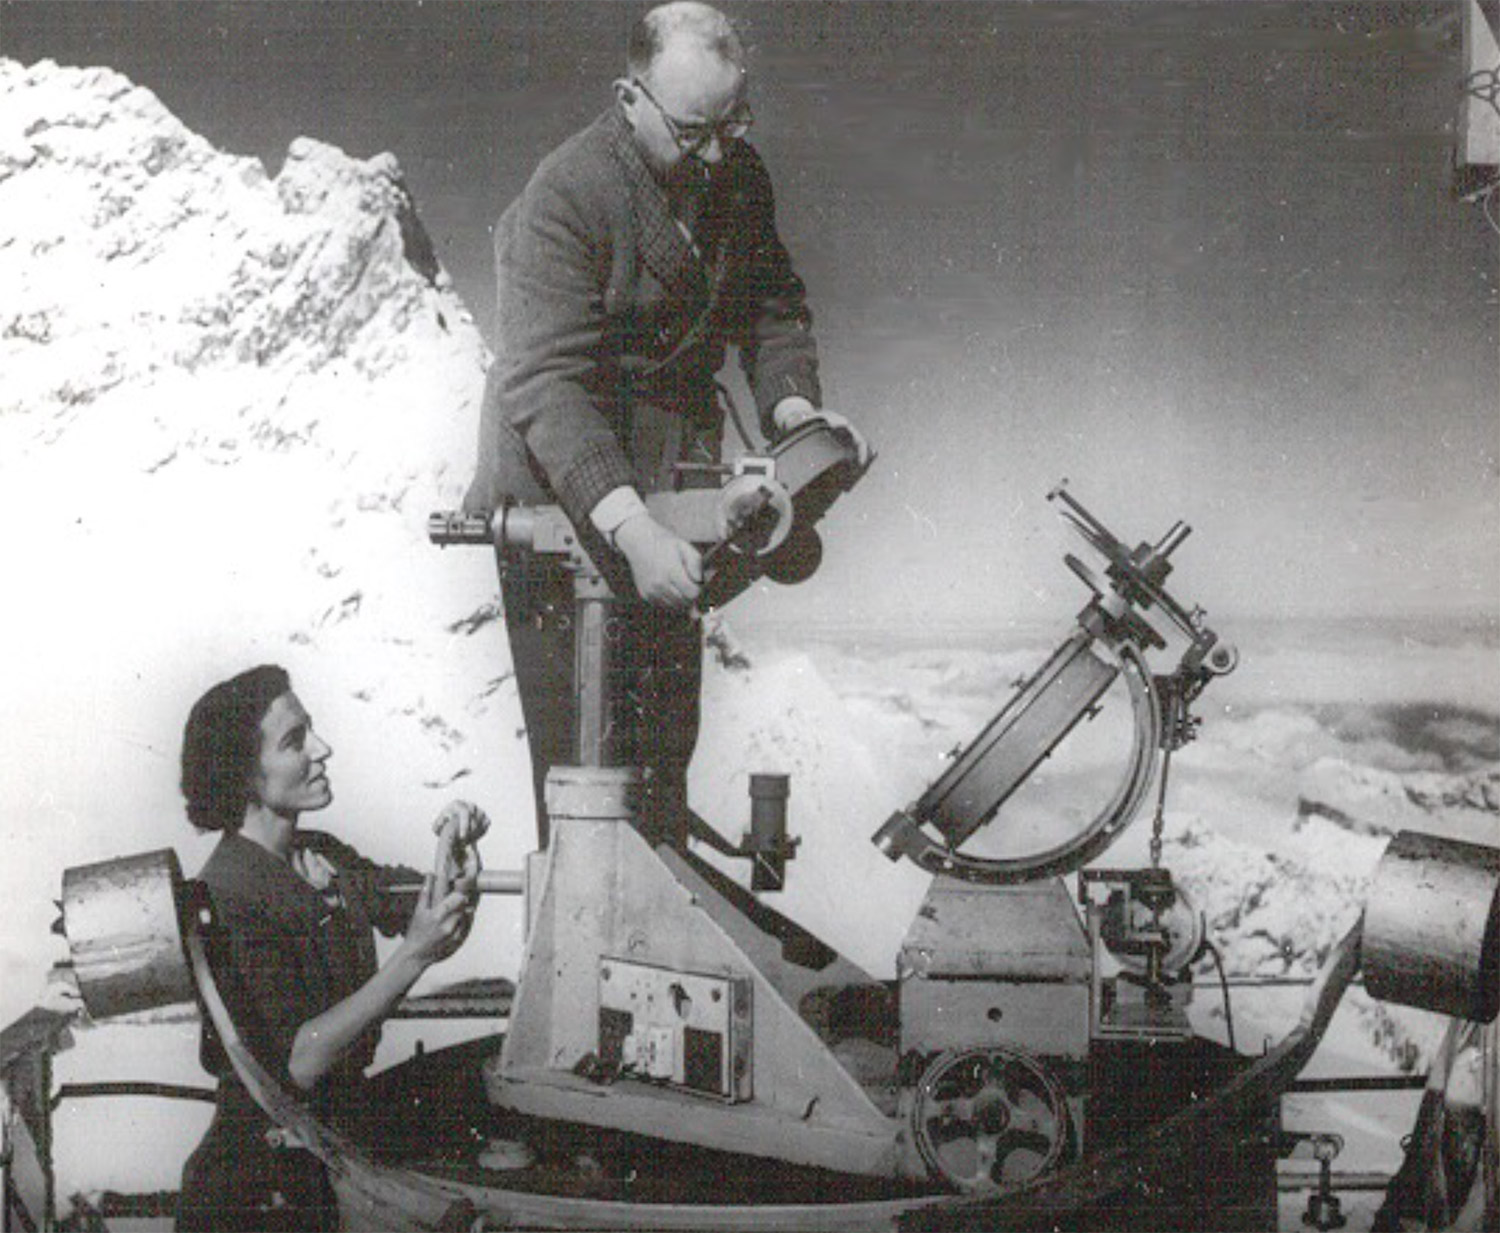
The research station on the Jungfraujoch has evolved significantly over the years. In the 1950s, it was still assumed that the composition of the atmosphere was largely stable. Consequently, the focus was initially on only a few parameters and individual gases, primarily classic greenhouse gases such as CO2 and water vapor, as well as simple meteorological parameters.
However, as research progressed, it became clear that the atmosphere is significantly more dynamic and that even the smallest changes in concentration can be significant. At the same time, technological advances enabled increasingly precise data. This allowed for a significant expansion in the number of gases studied: Today, around 20 to 30 trace gases—that is, gases present in the atmosphere only in very small amounts (less than 1%)—are continuously measured at the Jungfraujoch, supplemented by numerous other components as part of special studies.
platzhalter
How the FTIR Spectrometer works
How gases absorb color
Sunlight is a mixture of many colors, including the colors of a rainbow. And each color has its own wavelength. When sunlight passes through our atmosphere, some of it is absorbed—or, more accurately, swallowed—by gases. Each gas absorbs very specific colors of light, that is, specific wavelengths.
From sunlight to an Interferogram
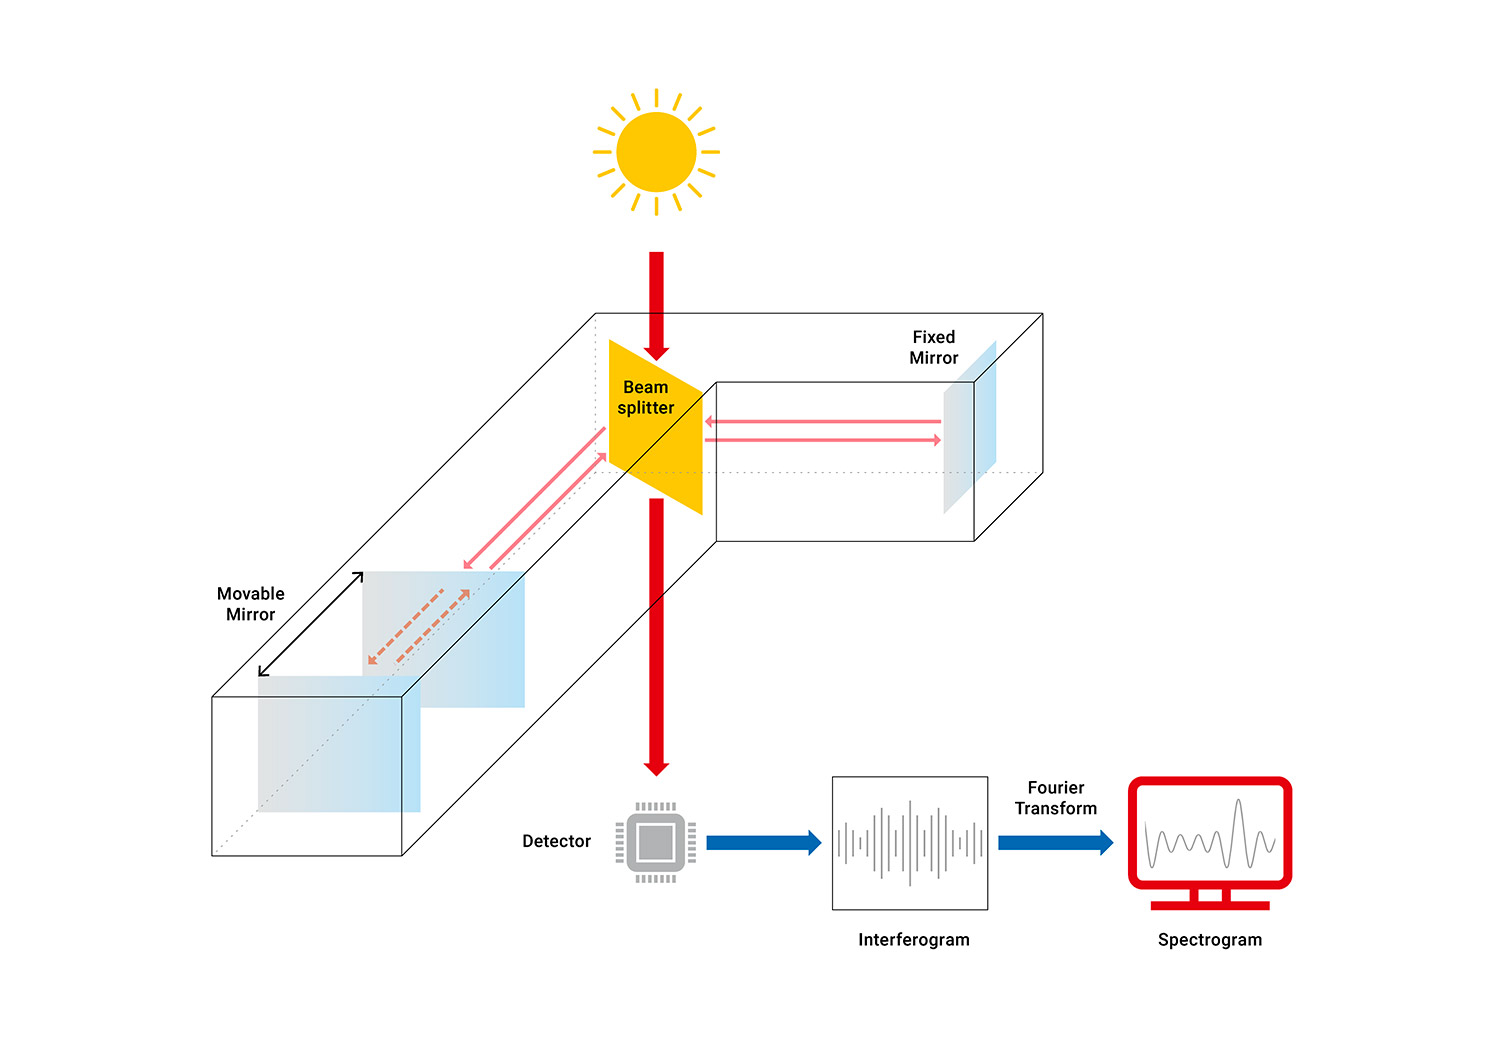
The FTIR collects sunlight after it has passed through the atmosphere—that is, the light that remains—and directs it into the interior of the instrument. There, the light strikes a beam splitter, which splits the light into two beams. One beam travels to a fixed mirror, the other to a movable mirror. Both beams are reflected and then converge again at the beam splitter. The beam directed toward the movable mirror thus travels a slightly longer or shorter path, depending on the position of the mirror.
This tiny difference in optical path length is at the heart of the measurement. When the two beams meet again and overlap, they either reinforce or cancel each other out. This results in a composite beam that is either brighter or dimmer. The detector measures the changes in brightness of this beam as the mirror moves. These measurements produce an interferogram.
The well-known Fourier transformation
This interferogram is a mixture of all colors of light. However, each color reacts differently to the varying path difference. To separate this mixture, we need what is known as the Fourier transformation. This allows us to calculate which colors are present in the light and in what proportions. The result of the Fourier transformation is a spectrum.
The Fingerprint of Gases
In this spectrum, you can see the typical “absorption lines”—that is, the wavelengths of light absorbed by the gases. Since each gas has a different absorption spectrum (like its own fingerprint), we can identify the gases and determine, based on the depth of the lines, how much of each was present in the atmosphere (concentration).
High up for precise measurements
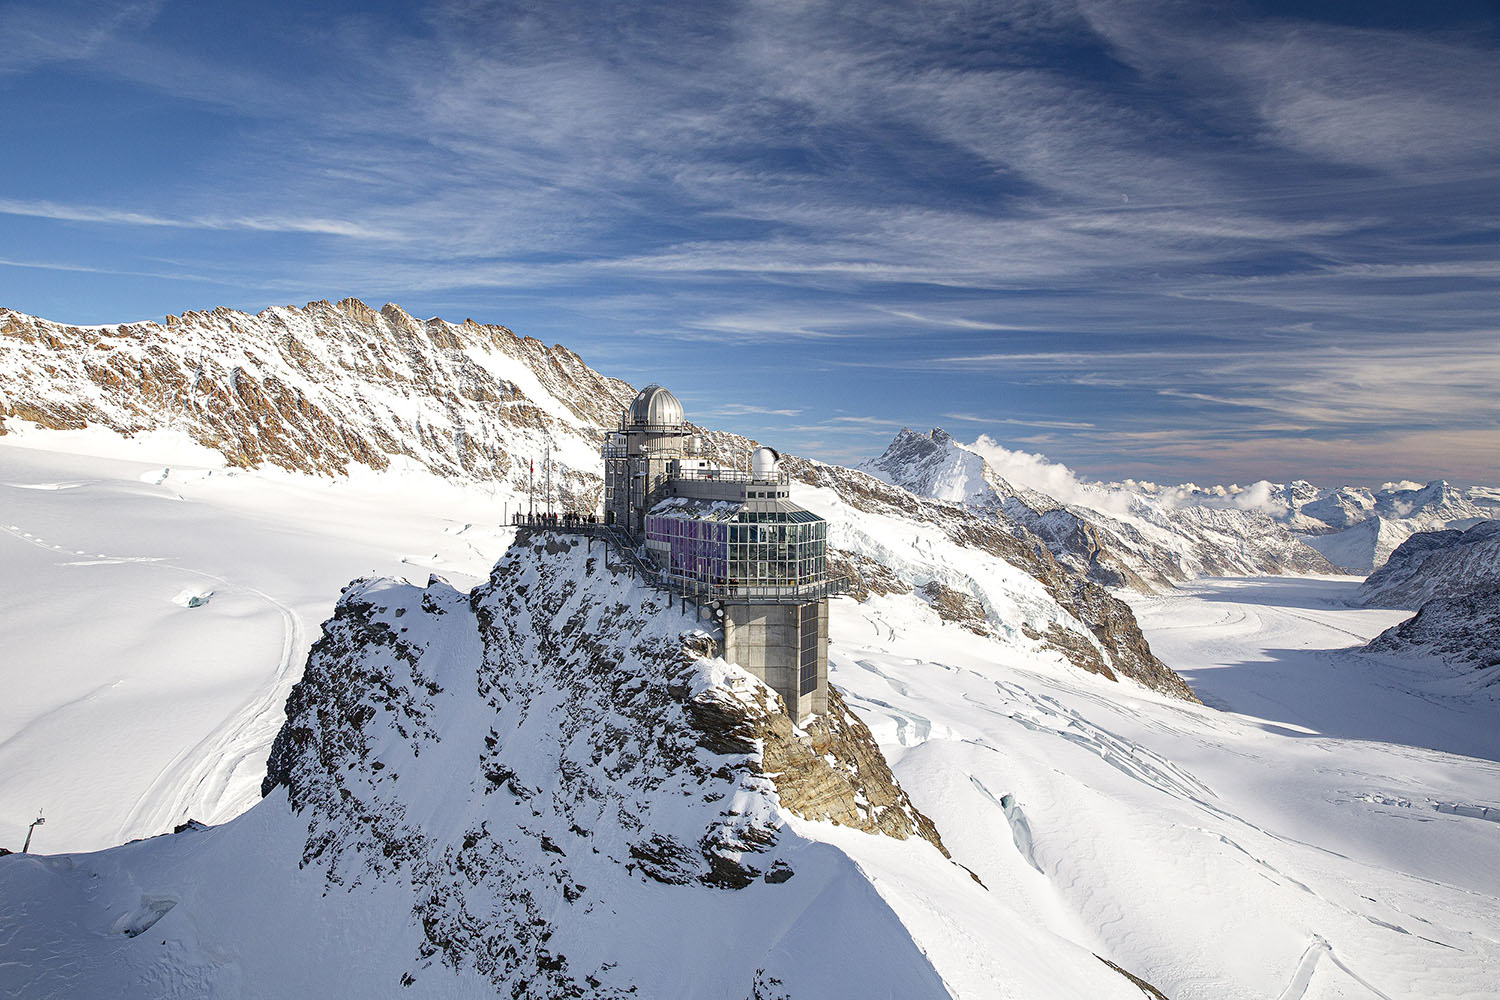
The research station on the Jungfraujoch is located there precisely because the conditions for atmospheric research are nearly ideal. At this altitude, the air is cold, dry, and very clean. Since cold air can generally hold less water vapor than warm air, this means there is significantly less water vapor in the atmosphere. This is crucial, because water vapor is the most abundant greenhouse gas and strongly influences measurements. It absorbs infrared radiation, thereby masking the characteristic “fingerprints” of other gases in the spectrum. At the Jungfraujoch, these interferences are very minimal. This allows researchers to study the composition of the atmosphere with exceptional precision and reliably detect even the smallest traces of other gases.
Seasonal Variations in the Atmosphere
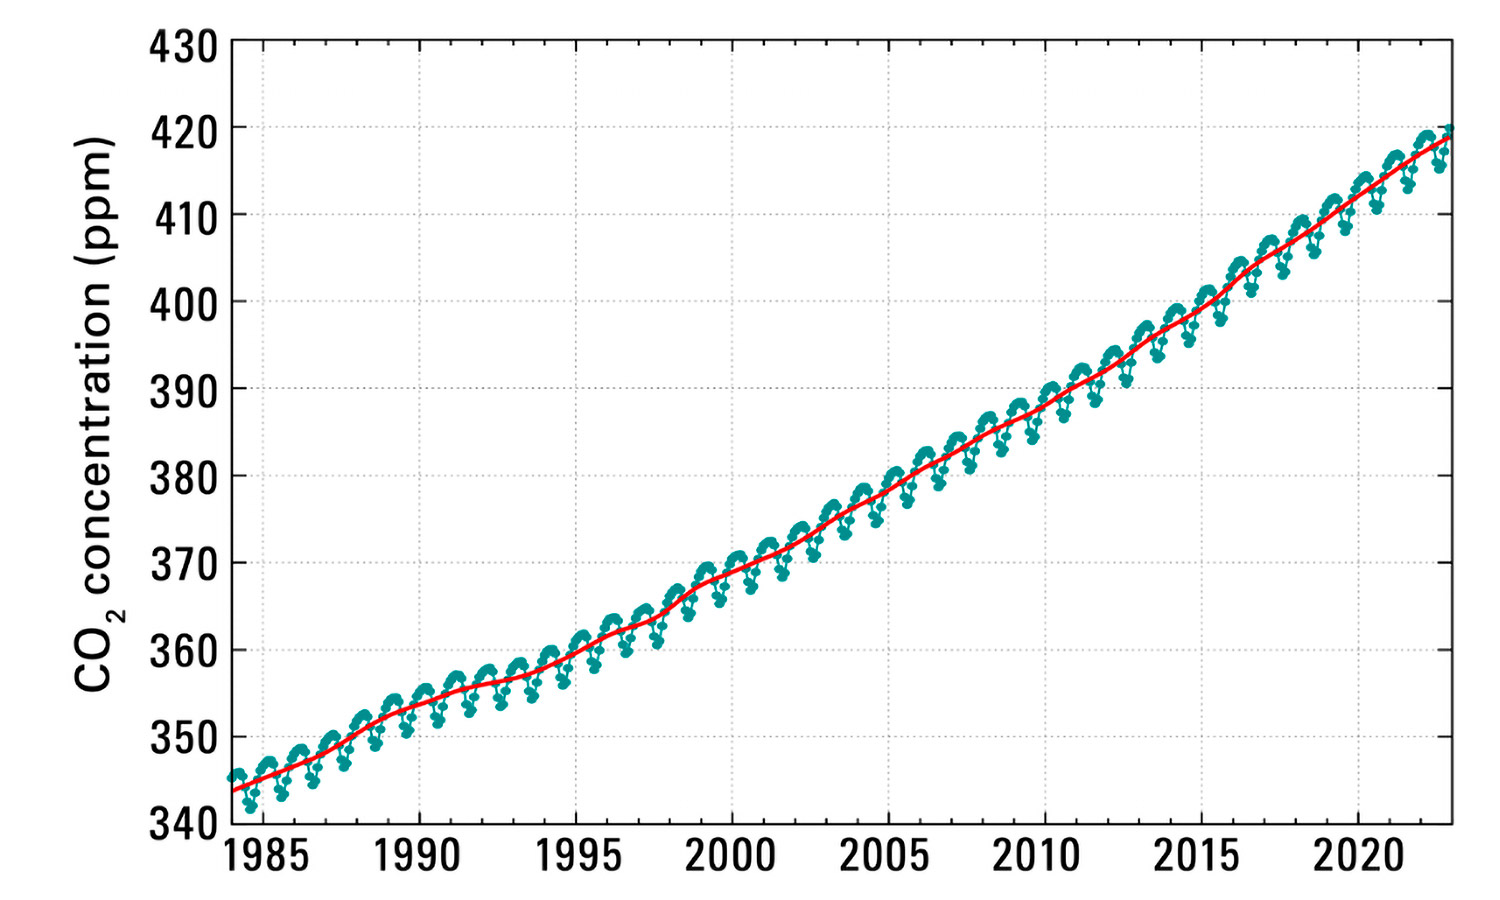
The composition of the atmosphere is not constant: the concentration of certain gases changes throughout the year in a regular pattern. This seasonal pattern is particularly evident in the case of CO2. The seasonal variations in atmospheric CO2 concentrations are primarily caused by changes in vegetation. In spring and summer, plants absorb more CO2 through photosynthesis, causing the concentration in the air to drop. In fall and winter, however, many plants lose their leaves or largely cease growing. As a result, less CO2 is absorbed from the air, and the concentration rises again. This pattern is particularly pronounced in the Northern Hemisphere, as there is significantly more land area—and thus vegetation—there than in the Southern Hemisphere.
Sources and sinks: a balance?
A source is anything that releases a gas into the atmosphere, while a sink is anything that absorbs it back or removes it from the atmosphere. The actual concentration of a gas in the air depends on whether the sources or the sinks predominate. This can be easily visualized using a bathtub: the faucet corresponds to the sources, the drain to the sinks, and the water level to the concentration in the atmosphere.
Today, efforts are being made to specifically create additional sinks or enhance existing ones in order to remove more greenhouse gases from the atmosphere. Examples include reforestation or the rewetting of wetlands, as plants can absorb CO2 through photosynthesis and store it long-term. Such measures can help mitigate the impacts of our lifestyle, but they do not replace the need to reduce emissions at the source.
Switzerland and Climate Change
Switzerland is particularly hard hit by climate change and is warming faster than the global average. The extent of this warming depends on how much greenhouse gas is emitted worldwide.
Climate scenarios are often described today in terms of warming levels: they show what Switzerland will look like with +2°C or +4°C of global warming, thereby making different future paths comparable. Depending on how things develop, warming of approximately +2°C (with strong climate protection) to +4°C or more is possible by the middle of the century.
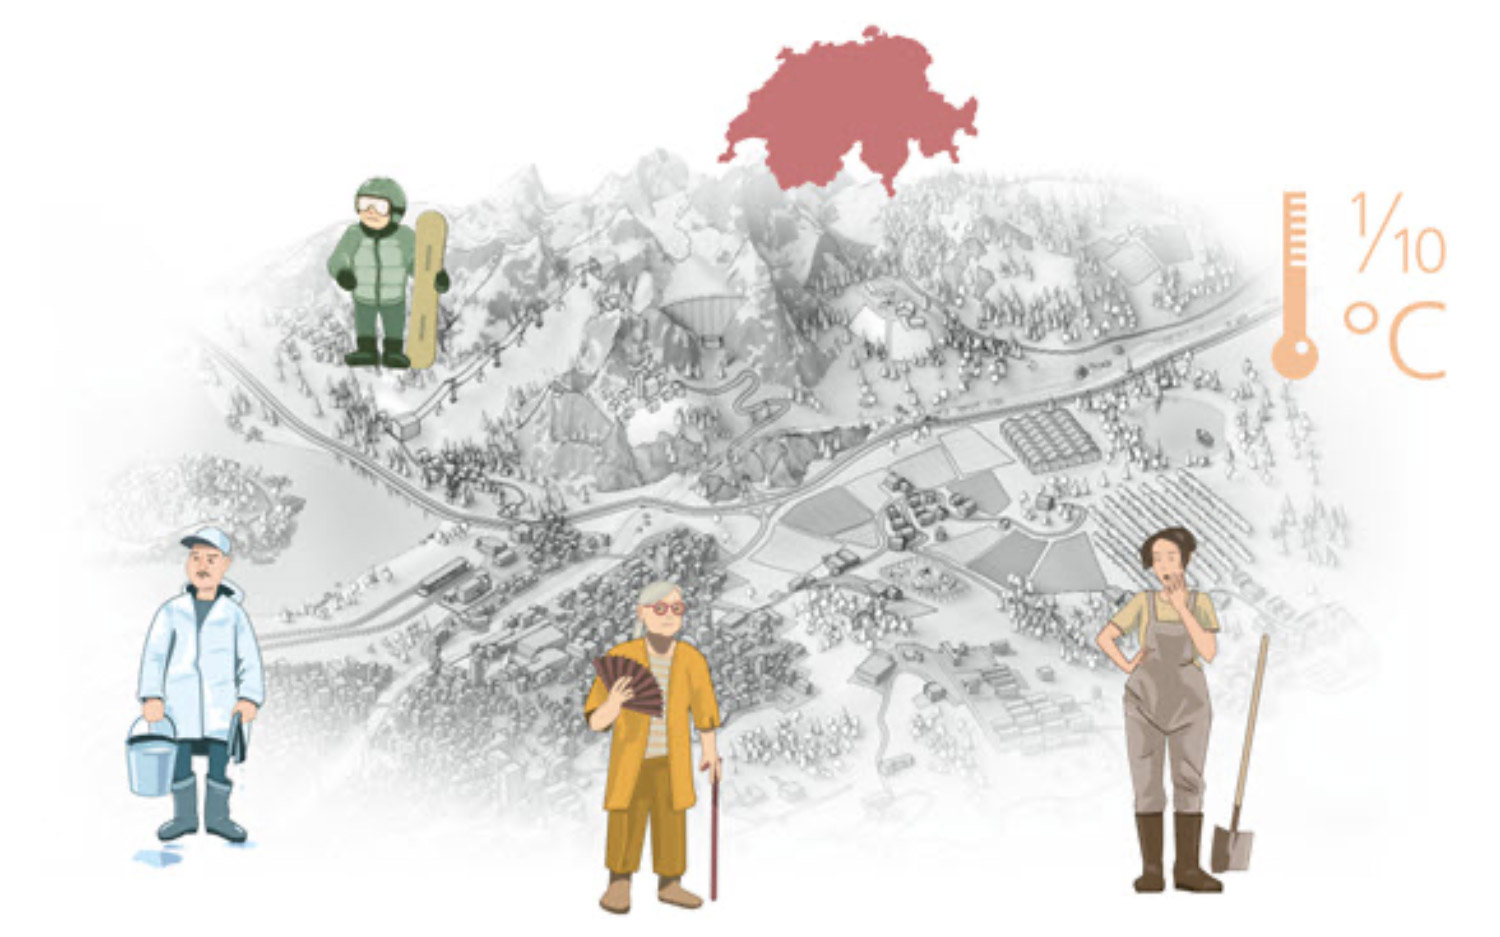
Between Drought and Heavy Rainfall
This warming has noticeable consequences: Heat waves are becoming more frequent, longer, and more intense, especially in cities and at lower elevations. The summer months are becoming drier, as there is less precipitation and evaporation is increasing at the same time. This has consequences for agriculture, forests, and water availability. When it rains, it often rains harder: heavy precipitation is on the rise, increasing the risk of flooding and landslides. At the same time, the snowline is rising, and winters are becoming milder and less snowy.
Climate scenarios do not predict a fixed future, but rather possible developments. They highlight just how much our decisions today influence the climate of tomorrow.